
Same buildings, two prices

Last Friday, 13 November, I spoke at an invite-only breakfast roundtable on global listed real estate with EPRA. Most of the morning was about the listed markets themselves, so I took the question from the investor's side: if you already own real estate through funds or directly, what do you gain by holding listed real estate next to it, what does it cost you, and how should the mix change over the cycle? You can download the deck at the end of this post.
Same buildings, two prices
A listed property company and a non-listed fund own the same kind of buildings, but the stock market prices the company every day while an appraiser values the fund's buildings once a quarter or once a year. It takes time to trade real estate and time to appraise it, but the stock market does not wait. A discount to NAV is the normal state for European listed property (the average since 1989 is 15.1%, according to EPRA data), but it reached 48.9% in November 2008 and 46.1% in September 2022, in both cases before the valuers had written the buildings down. SEGRO's shares, for example, fell by 32.0% in the first half of 2022 while its reported NAV rose by 9.8%. The NAV only followed in the second half, with a fall of 22.7%.
Over longer periods, however, the two routes move largely together. In US data from 1984 to 2023, Norges Bank Investment Management finds a correlation between listed and unlisted real estate of 0.39 over one quarter and 0.73 over five years, while the correlation of listed real estate with equities falls from 0.66 to 0.27. For an investor with a horizon of five years or longer, the two routes look increasingly alike. For anyone who reports quarterly, they don't.
Source: EPRA, Macro Real Estate (deck, slide 3)
The price of liquidity is volatility
The cost, of course,of the listed route is volatility. Research by the University of Reading for EPRA puts the standard deviation of quarterly total returns in Europe from 2008 to 2024 at 10.8% for listed real estate, against 2.0% for non-listed funds. Some of that calm is appraisal smoothing, but even once it is removed (5.1% for the funds) listed real estate is about twice as volatile, partly because of leverage: the EPRA loan-to-value was 38.7% at the end of 2025, against fund gearing of 24.6% according to INREV. The European property ETF we use in the deck lost 37.2% in 2022.
The case rests on access and timing
I am not arguing that listed real estate beats private real estate, or that holding both gives much diversification in the long run. The first argument is access. Many investors can see which sector the economy is pushing forward, but getting capital into it in time is harder. The market value of listed healthcare landlords in the US and Europe rose from USD 105 billion in January 2024 to USD 280 billion in August 2026, including new shares and acquisitions (two-thirds of the increase is Welltower alone, but the rest of the basket still doubled), and the key driver is demographics. Through the listed market an investor can have that exposure within days, while a private platform takes years to build, and the listed position shows every quarter how the sector reacts to the economy and to interest rates before any capital is committed for ten years. The listed market is not always first, I should add: in European logistics, the non-listed funds moved further than the listed companies did, according to EPRA and INREV.
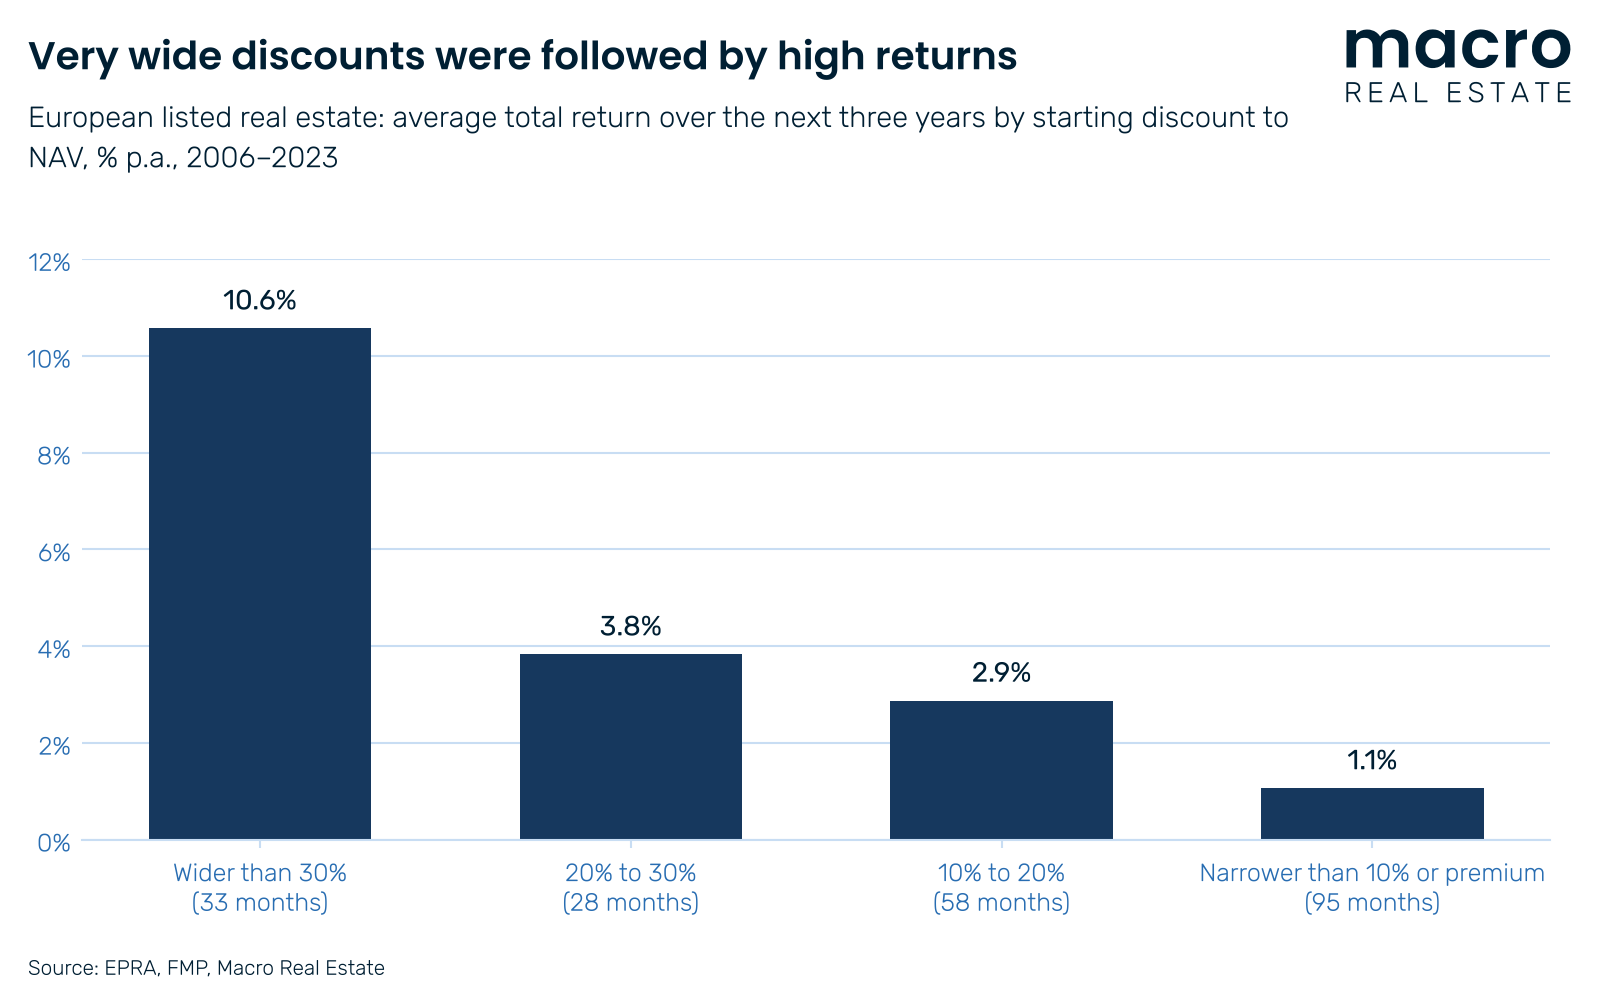
The second argument is timing. We took EPRA's discount to NAV at each month-end since February 2006 and looked at the total return of European listed real estate over the following three years. When the starting discount was wider than 30%, the average return was 10.6% a year, against 1.1% when shares traded at a discount of less than 10% or at a premium. The caveats are important, however: a discount of more than 30% occurred in only 33 of 214 months, in three episodes, the three-year windows overlap, and the buckets in between show little difference, so the signal is in the extremes only. Nareit finds a similar order in the US: across 11 episodes since 1978, REITs returned 36.4% on average in the four quarters after the low point of their performance relative to private core funds, while the funds returned 5.1%.
Source: EPRA, FMP, Macro Real Estate (deck, slide 10)
Where are we now?
Here one has to be careful, because Europe today is not the clean early-cycle picture of 2009. The discount to NAV was 32.6% at the end of August, more than twice its long-term average, which says add. But the ECB has raised its main refinancing rate twice this year, to 2.65%, and held it there in October, which says wait. At a loan-to-value of 38.7%, a discount of 32.6% on the shares is a discount of roughly 20% on the buildings, and it can close through higher share prices or through lower valuations. In German residential and in offices, some of it is likely to be the latter and that is indeed what our Fair Market Value model (reach out for details) tells us. What can be said is that an investor adding European real estate today pays considerably less for it on the stock exchange than in a fund priced at NAV.
What to do
- Put listed and non-listed real estate under one team with one view on sectors and countries, as NBIM, APG and Bouwinvest have done. If nobody in your organisation decides whether the next euro of real estate goes into a listed company or into a fund, the two are managed in silos.
- Set a base weight for listed real estate and a range around it, e.g. 30% of the real estate allocation with a range of 20–40%, and agree its risk budget and benchmark before a drawdown, not during one.
- Tie the tilt to things you can observe: the discount to NAV, the direction of policy rates and equity issuance by listed companies. In Europe today, that points to adding listed exposure gradually. But keep an eye on the ECB.
- Enter new sectors through the listed route, senior housing and care homes above all (you might be too late on the most traded tickets), and build the non-listed exposure once you know the sector.
- Measure both routes over at least five years, and compare them at the same leverage.
Many investors hesitated on logistics 10 to 15 years ago because the sector was unfamiliar to them. The listed market offers a way into the next one before the private platforms exist, as long as the volatility has been budgeted for in advance.
Download the slides
If you would like us to take your investment committee through the deck, or to help you design a combined listed and non-listed strategy, feel free to reach out.
Free for members
Read the full article
Our Thoughts are free for registered members. Sign up with your email, or log in if you already have an account.